Purpose
Quickly give your clients a snapshot of how tax-efficient their portfolio is and how much that is worth to them.
The Client Review Report is designed for conversations with a client when you don’t necessarily want to recommend any changes. Think of this as a simple update: where they are now and what that is worth. If you or the client decide to dig into how to improve the Taxficient Score, check out our Proposal report for new prospects or the Held-away report to ask for accounts that are managed outside your firm.
We believe in Advisor Alpha, specifically alpha that comes from areas you directly influence.
- Asset Allocation across the household and all the accounts aimed at retirement
- The tax efficiency of a portfolio is quantified and measured using the Taxficient Score®
PRO TIP: Quantifying client’s after-tax benefits is a breakthrough way of measuring value that you are adding to that relationship. It’s a pointed way to clearly highlight the benefits you bring.
Talk Track
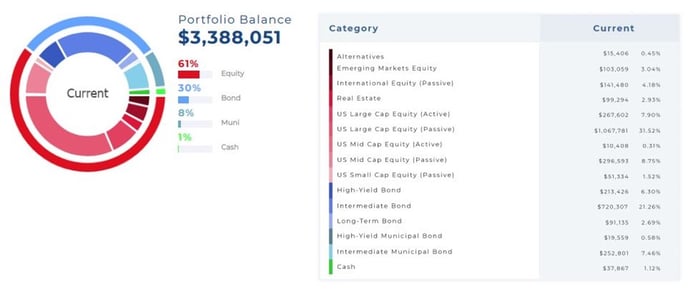
The first page of the Client Review shows the client’s current portfolio asset allocation broken down by asset category. You can use it to set the stage for a tax efficiency conversation.

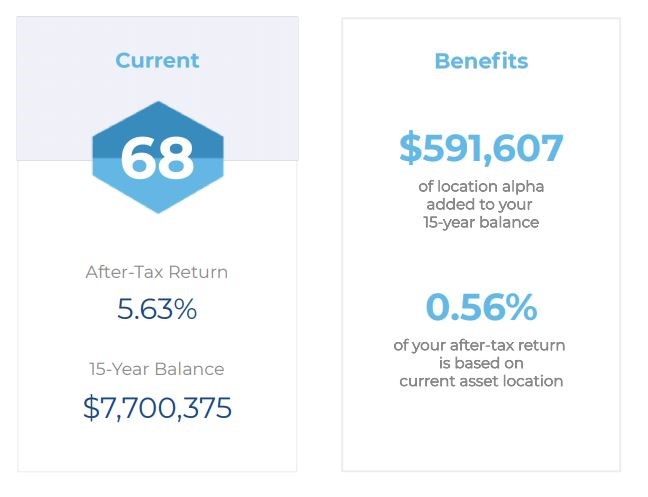
Page two is all about the Taxficient Score®. It measures the client’s current portfolio on a scale of 0-100.
The Benefits listed on the right highlight:
- Dollar amount of additional after-tax benefits your clients can expect over the time frame you select. This is being measured from 0, which would be a portfolio with very poor asset location.
- Percentage increase in after-tax return due to asset location.
Talking Point – If a tree falls in the middle of a forest, and nobody hears it, did it even fall? Until recently, asset location has been a theoretical conversation at best. This report can help your clients really understand where they stand and how much it is worth to them.
This page was designed to clearly articulate the Advisor Alpha generated through an advisor’s unique asset location strategy – without diving into the details or offering up individual changes to improve the score.
PRO TIP: We have run trillions of dollars through our algorithms and found the average score to be a 52. If your clients are above that, they are already starting from a good place!

Additional Details
Page three and beyond is supporting documentation, including the list of accounts that make up this portfolio, as well as specific account allocations and positions. If an account is marked as held-away or locked, it is likely limiting the amount of optimization that can be achieved.
The Held-Away report discusses this scenario in more detail.
The supporting documentation also includes the inputs that the LifeYield engine uses for optimization, including Tax Rates, Gain Limits and Capital Market Assumptions. These are placed at the end to keep the focus on the main objective of the report: providing a snapshot of your client’s Current Taxficient Score and illustrating the after-tax benefits their score derives.
NOTE: Make sure to update your disclosures in the Settings tab of LifeYield. They are automatically generated at the end of each report*