Purpose
The Social Security Analysis report was created for conversations with both prospects and clients. As a LifeYield customer, this report allows you to help you compare two Social Security filing strategies while drilling down into income needs required to follow through with that plan. This report helps you structure the conversation so that all types of investors can understand the benefits of your approach without requiring you to do manual calculations.
When it comes to your current clients, this report lets you approach them with a structured narrative that shows them how you’ll maximize their retirement and Social Security benefits.
You can use this report in any situation where you’re helping decide on the best Social Security filing strategy, which may provide the greatest total benefit over the client’s lifetime (at a specific point in time and given certain specific circumstances).
This report can be ran on either a single strategy, or a comparison. This Playbook illustrates a Comparison Report which highlights the difference between the custom strategy and the optimal strategy as defined by LifeYield.
Talk Track
The first page shows a summary of our approach that breaks down the various nuances of Social Security and the way LifeYield Social Security+ handles them in terms of your client’s case.
Page two reviews all of the investor’s specific inputs. This is where you can point to the main variables that were used to build the case. The charts show the estimated monthly benefits and the cumulative benefits over time, highlighting the difference.

Page three is where you’ll find the detailed income schedule for both Optimal and Custom strategies side-by-side. This allows both you and clients to easily compare the difference between strategies.
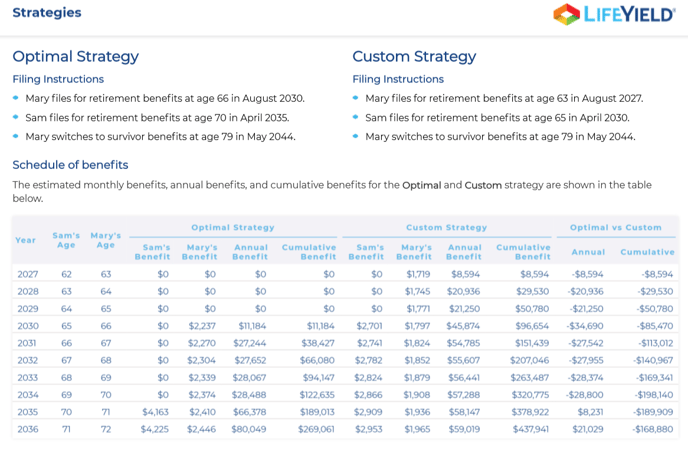
This was designed to highlight the annual and cumulative difference for you. This eliminates the need for you to have to do the manual math and makes it easier for you to prepare for client conversations.
Talking Point: By pointing out each strategy’s filing instructions, it becomes easier for clients to see the difference between each option. Coupled with the Schedule of benefits, it’s even easier to then point to the numerical benefit when comparing the Optimal to the Custom filing strategy.
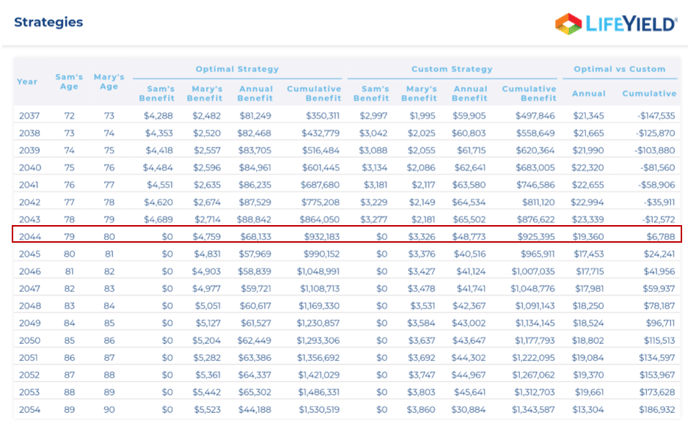
Page four continues the Schedule of Benefits chart. On this page, you will be able to point to the specific year in which clients will hit their breakeven point. The chart continues to illustrate their lifetime benefit amount from Social Security until they reach the end of their life expectancy.
Page five is your introduction to Income Layers. This page was designed to show you the inputs that were entered into the tool for each layer of income. We provide a brief explanation next to each layer to clarify what each income piece means in terms of your client’s retirement.
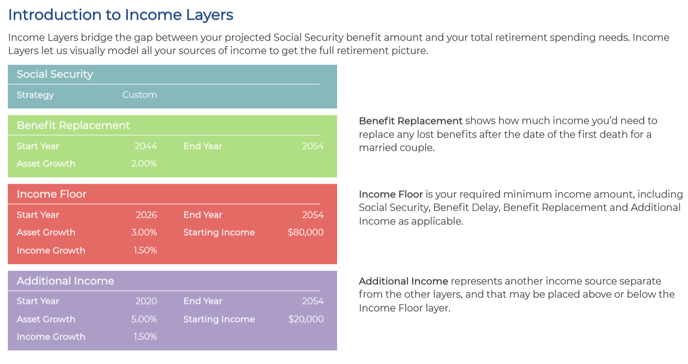
PRO TIP: When you are setting up the Income Layers, you can change the names of each layer to represent an income stream e.g. a Pension or required spending amount.
If you customized any of the Income Layers, this will be where you’ll see the customizations reflected in the report. We added this to show you how much your clients will need to bridge any income gaps and how the rest of the client’s income looks alongside Social Security.
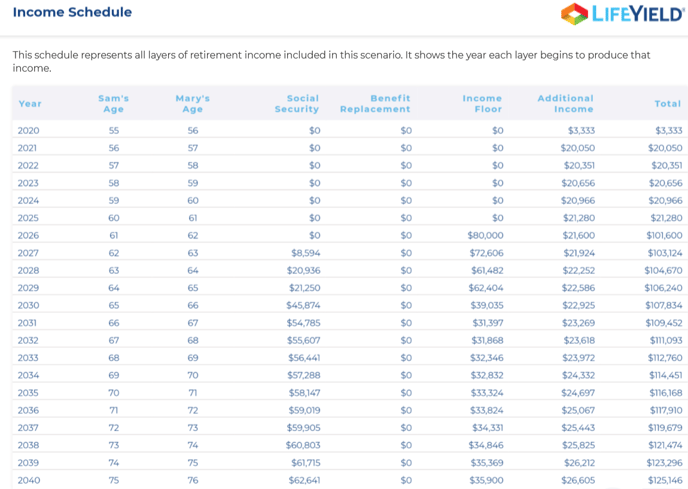
Page seven breaks down the Income Schedule on one simplified page. This shows the entire schedule for whatever you’ve enabled in the tool. This schedule drills down to the dollar benefit for each year to make the benefits even clearer during your review meetings.
Page nine is where you will see the Asset Balance Schedule. The Asset balance schedule was created so that you can see easily where clients are spending/withdrawing their assets, all the way to the end year (to demonstrate them using up all of their money/savings).
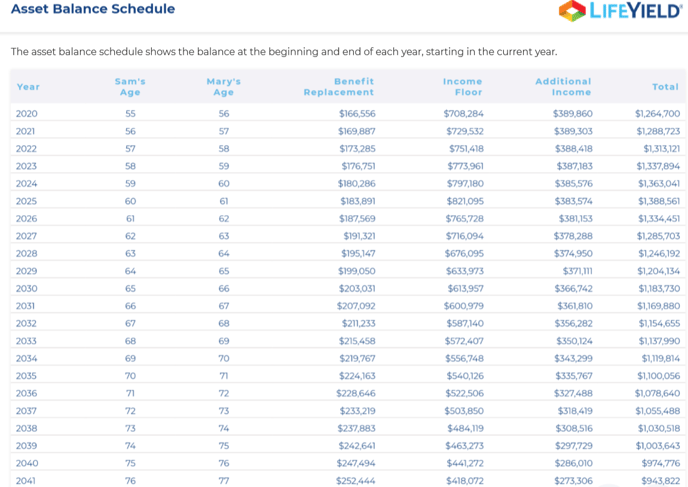
This section of the report allows you to quickly drill into one layer or a particular year to see how that factors into your clients’ retirement decision.
PRO TIP: Using an “income floor” helps you show your client how you’ll fulfill their minimum spend in retirement.
Additional Details
The supporting documentation also includes the assumptions that LifeYield takes when approaching Social Security. These are placed at the end to keep the focus on the main objective of the report: The Social Security Analysis.
NOTE: Make sure to update your disclosures in the Settings tab of LifeYield. They are automatically generated at the end of each report