Are you having effective conversations with your clients about how YOU can help them increase their Social Security in retirement?
-
Social Security+ combines detailed analysis with a simple interface
-
Compare filing strategies quickly and illustrate the benefit of coordinating your clients’ retirement
-
This guide shows how to access all its features


In this case, you'd receive ~$2,129 MORE if you wait until 70!

In this case, you'd realize ~$419,005 MORE if you wait until 70.
Advanced Options
-
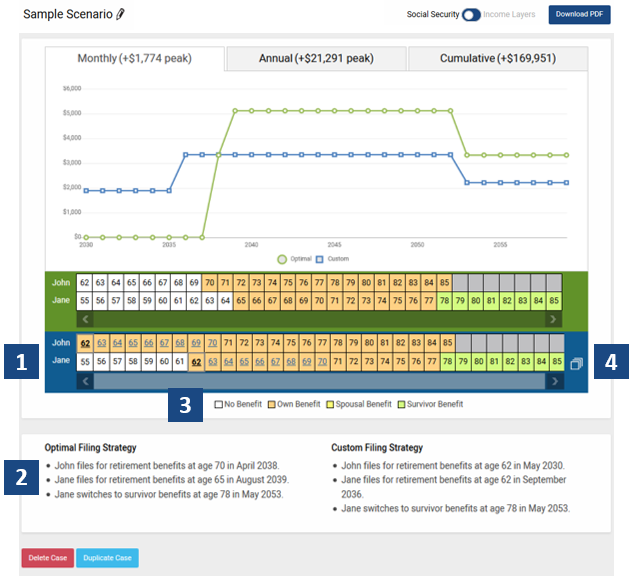
Custom strategy age combinations - Tap or click on blue-colored ages to change the Custom strategy. A client starts to receive benefits at the selected age. The Custom strategy can be modified either via the Timeline view, or by changing the Retirement Age inputs for each client.
-
Filing instructions for both the Optimal & Custom strategies are always available below the graph & timeline
-
Key showing how the timeline’s color-coding translates to the type of benefit (if any) being received by the client.
-
The Alternatives selector shows all the possible Custom filing strategies for the age(s) provided, along with the cumulative benefit amount for each. The color-coding shows the type and sequence of benefits, using the same colors as the timeline itself. The currently displayed strategy is highlighted in blue. Just tap/click alternatives to switch between Custom filing strategies for comparison with the Optimal strategy. The selected Custom strategy automatically shows in the chart, the Filing Instructions, and the downloadable report.
Social Security+ combines detailed analysis with a simple interface. This guide shows how to access all its features.
-
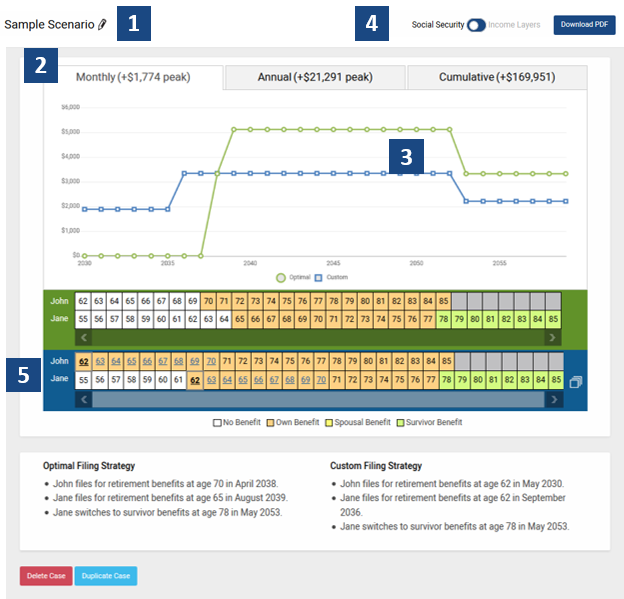
Click
 to enter client data and Cost of Living Adjustment in pop-up window as seen on the window to the right. Default COLA is set to 0% to show results in today’s dollars
 -
Graph of Optimal vs. Custom strategies instantly appears. Click desired timeframe to compare benefit amounts:
Monthly
Annual
Cumulative (shows break-even point)
-
Click any point (year) on the graph to compare Optimal vs. Custom Strategy Benefit.
-
Click
 to view & print a detailed report of the filing strategy your client prefers & Switch to Income Layers Analysis
 -
Timeline to change claiming age(s) under Custom strategy. The graph instantly adjusts.
Using Income Layers

-
Click
to enter client data in pop-up window as seen on the window to the right. -
This toggle will switch you between Social Security details and Income Layers.
-
Branded reports for SSA and Income Layers.
-
The Income Chart illustrates a year over year analysis of how much spending will be available in any year and where the money will come from to achieve the desired spending.
-
This chart illustrates a year over year analysis of the Assets value, broken apart by the defined layers. Present year illustrates the capital needed to fulfill future income.
Each layer of income offers inputs you can edit by selecting them. Here is a list of definitions to assist in building out your income layers.
- Strategy – switch between filing strategies defined on SSA screen.
- Start Year – this is the year this layer starts producing income.
- End Year – this is the year this layer stops producing income.
- Asset Growth – This is the after-tax expected rate of return for this layer.
- Start Value – amount of income annually in todays dollars.
- Value Growth – the rate of growth that should be considered for inflation and/or spending power.