Create a quick proposal
Are you having effective conversations with your clients about how YOU can help them maximize their after-tax return?
- LifeYield’s Taxficient Score® offers advisors an easy way to explain the value of multiple-account management in after-tax dollars
-
Like a credit score, the Taxficient Score® assesses the tax efficiency –often referred to as asset location –of a client’s accounts on a scale of 0-100
-
This guide shows how to access all its features
-
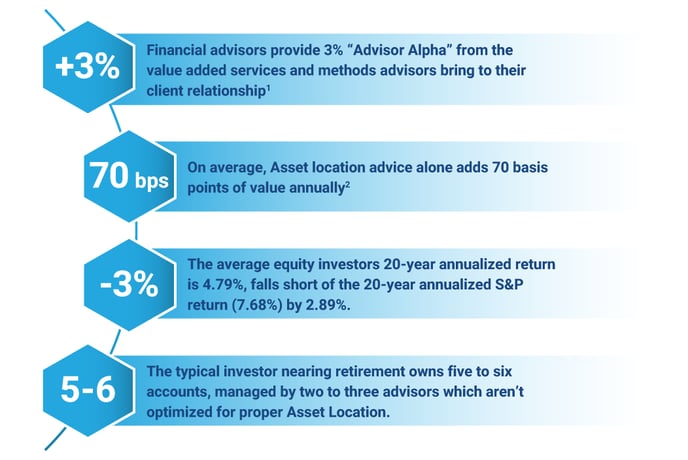
“Putting a value on your value: Quantifying Vanguard Advisor’s Alpha®“. -Vanguard
-
“Capital Sigma: The Return on Advice”. -Envestnet
“An ongoing debate among investment advisors and their clients centers on value: creating it, preserving it, and perpetuating it. Each faces a different challenge: Advisors are tasked with delivering worth to their clients, and clients need to understand what they can expect for the dollars they spend” –Envestnet
LifeYield provides a simple way for advisors to engage prospects and clients with tools to illustrate the benefit of coordinating every investment account.
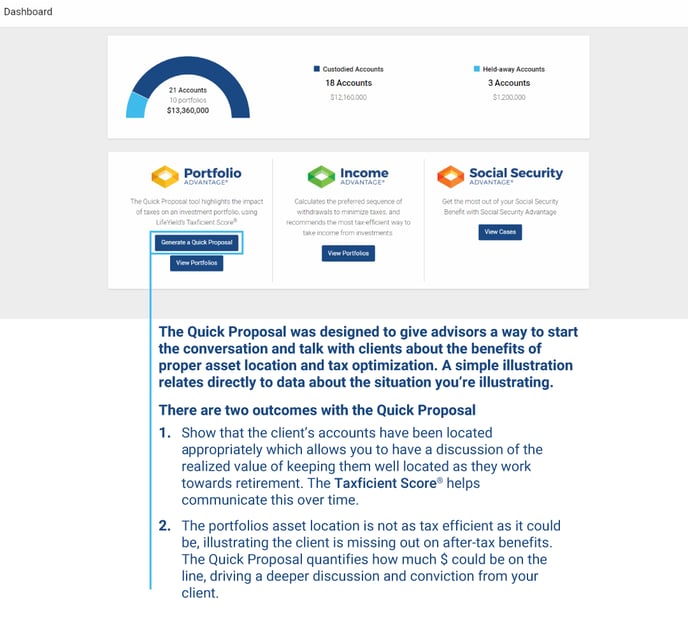
The LifeYield Quick Proposal combines the intelligence of detailed analysis with a simple interface. This guide shows how to access all its features
If you can show a prospect that you might be able to help them uncover an additional 100k over the next 10 years, is there any reason they wouldn’t want you to do a complete review of all their accounts?
Taxficient Score® & After-Tax Return
LifeYield's Taxfiecient Score® offers advisors an easy way to explain the value of multiple-account management in after-tax dollars and returns to their clients, without getting into mathematical algorithmic detail. Like a credit score, the Taxficient Score assesses the tax efficiency of a client's portfolio on a scale of 0 to 100. The higher the score, the better position an investor is to minimize taxes to make and keep more money, as well as achieve retirement goals.
-
This tool allows you to introduce the concept of tax efficiency and how their assets are located across the accounts that they own
-
We found that the average TaxficientScore for most portfolios is 50-52
-
Proposed location can’t get to 100 as the client has an account that is held away
-
Great way for advisors to talk to their clients about the benefit to consolidating assets that will allow them to get their TaxficientScore to 100
-
Account Type
Indicates the type of “registration” for an account. An account may be either Taxable, Tax-Deferred, or Tax-Free. The account type is significant in helping to determine where to best place the assets across the different accounts to achieve the best TaxficientScore and highest after-tax returns.
Asset Location
Asset location is a tax-minimization strategy of placing investments in accounts that will ultimately produce the highest after-tax returns for the investor’s entire portfolio. The process is to put your highly taxed investments in your IRA and Roth accounts, and your tax-efficient assets in your brokerage accounts
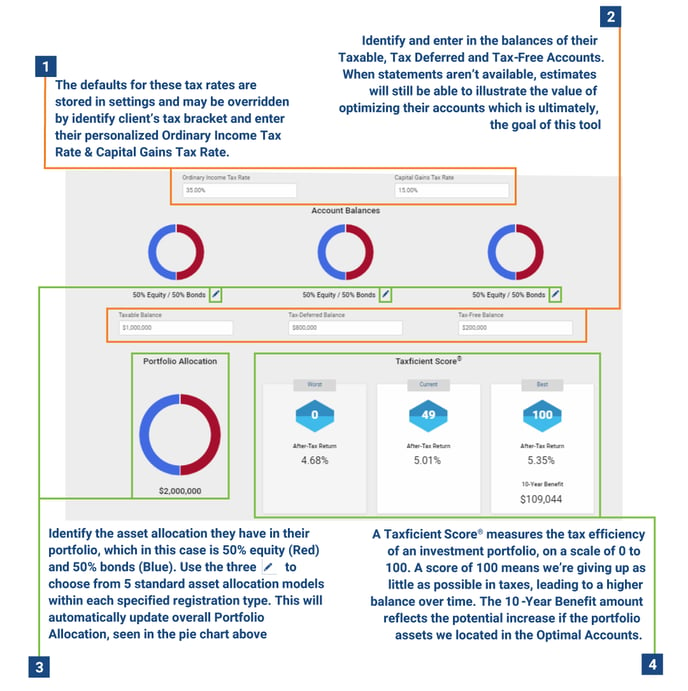
Capital Gains Tax Rate
The tax rate applied to long-term capital gains; sales of assets held for more than one year and that have appreciated in value since purchase. The user can set the default Capital Gains Tax Rate in the Settings page and can also set a portfolio specific rate by editing the portfolio’s details. Sales of any appreciated assets held for a year or less are considered short-term capital gains and are taxed using the Ordinary Income Tax Rate.
Capital Market Assumptions (CMAs)
These are forecasted estimates of an asset category’s expected total return. In addition to the total yield, the CMAs may also include yield, dividend, turnover, standard deviation, and equivalent asset groups (substitute asset classes). When determining the after-tax return of an asset category held in a taxable account, any portion of the total return designated as dividends is taxed at the capital gains tax rate (i.e. is treated as a qualified dividend) and any portion designated as yield is taxed at the ordinary income tax rate, except for tax-free fixed income where no taxes are deducted. Any capital appreciation associated with an asset category is taxed according to the turnover rate. Any turnover up to 100% is considered long-term, meaning the capital gains rate is applied according to the rate provided. Any turnover above 100% is considered short-term, meaning the ordinary income tax rate is applied to that portion.
Custodied Accounts
Accounts in which the assets are currently managed by the advisor, or custodied at the advisor’s affiliated institution.
Excluded Accounts
Accounts within the client’s portfolio that will not be included or considered in any TaxficientScore calculations, or any other LifeYieldcalculations or projections. Accounts types that may often be excluded include: 529 plans, 401k plans, & RAs
Held-Away Accounts
Accounts in which the assets are not actively managed by the advisor or custodian affiliated with the advisor’s financial institution. Advisors may often have access to view these accounts by using account aggregation software tools and with the permission of their clients. Including the held-away accounts in the Taxficientcalculations often incentivizes the client to consolidate these assets with the advisor.
Investment Time Frame
A user selected time period used in the TaxficientScore projections. After-Tax returns, balances, and yearly tax costs are projected over this time frame. The time frame may be set to 10, 15, 20, 25, or 30 years in duration. The advisor sets the Investment time frame for the client on the settings page.
Ordinary Income Tax Rate
This is the tax rate on a client’s ordinary income. It is set by the advisor and is a blended rate based upon a client’s expected state and federal income taxes. The advisor sets the Ordinary Income Tax Rate for the client in the settings page
Proposed Portfolio
The suggested asset allocation across the different registrations of Taxable, Tax-deferred, and Tax-free for achieving the highest Taxficient Score and highest portfolio after-tax returns. This is created when generating a proposal.
Projected Portfolio Balance
Projects the potential yearly portfolio balances during the selected investment time frame. Illustrating and comparing the yearly after-tax return balances for the TaxficientScore of Worst, Current and Best. Created when generating a proposal.
Equivalent Asset Groups
Assets that are similar to the client’s primary asset categories. They may be substituted in the different registration types in order to deliver the highest after-tax returns while maintaining the portfolio’s target allocation.
Projected Portfolio Taxes
Projects the potential yearly taxes incurred during the selected investment time frame. Illustrating and comparing the yearly tax costs for the TaxficientScores of Worst, Current and Best. This is created when generating a proposal
Taxficient Scores
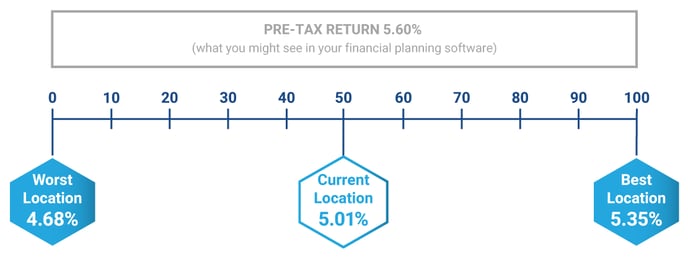
A Taxficientscore measures the tax efficiency of an investment portfolio, on a scale from 0 to 100. LifeYieldcalculates the Worst, Current and Best Scores.
- Worst: projected after-tax returns of a client’s assets when they are distributed across the different account registrations where they will perform with the lowest tax-efficiency, thus returning the lowest balance over time.
- Current: projected after-tax returns of the client’s current asset location across the different account registrations.
- Best: projected after-tax returns where a client would get the maximum benefit. A score of 100 means giving up as little as possible in taxes on investment returns, leading to a higher balance over time.