Learn how to illustrate different layers of income in retirement using LifeYield Social Security+.
This knowledge-base article will walk you through how to use LifeYield’s Income Layer’s tool. Once an advisor uses LifeYield’s Social Security+ to determine a client’s filing strategy, Income Layers will help further illustrate the various layers of income in retirement and estimate in today’s dollars how much assets are needed to achieve income goals for clients.
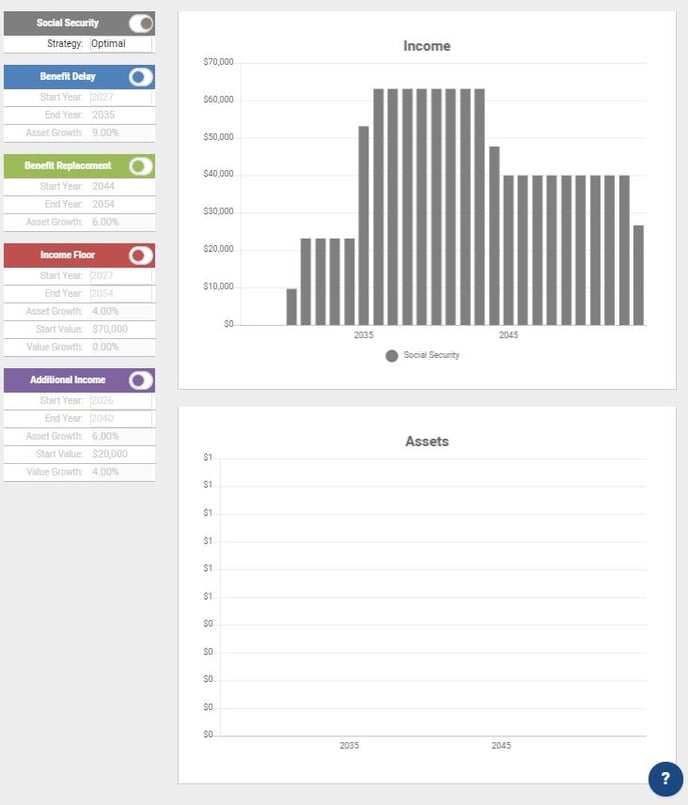
Within the Income Layers screenshot below, you will notice 5 different color boxes on the left-hand side with toggles to switch on and off. These represent the different layers of income your clients are likely to receive in retirement. You will see that only the grey Social Security toggle is turned on, populating the ‘Income’ chart to illustrate all the income that this couple will receive from the Social Security Administration upon filing.
The blank Assets chart on the bottom represents the assets needed in today’s dollars to achieve the level of income represented in the Income chart. As mentioned above, only the Social Security income toggle is turned on, automatically leaving the Assets chart blank because of course, the money will be coming from the Social Security Administration.

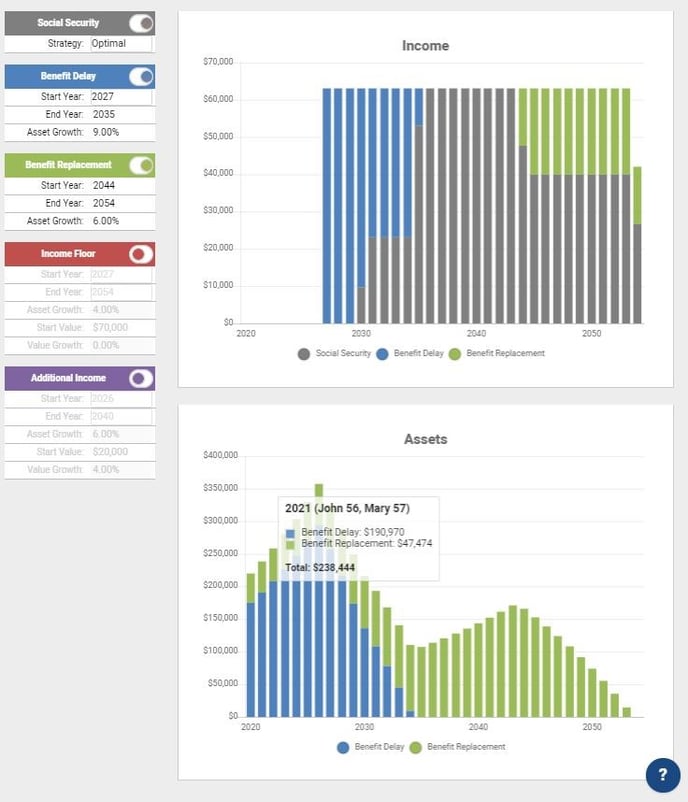
In the screenshot below, you will see that the blue Benefit Delay and green Benefit Replacement toggles have been turned on as well.
The first question a client might ask his/her advisor is are we able to afford to delay the timing of filing for social security? Turning on the blue Benefit Delay income layer toggle helps advisors determine the number of assets needed today to maintain the same level of income that will be coming from Social Security prior to filing to help answer this question.
In the screenshot below, you will see that once the Benefit Delay income layer is turned on, the ‘Income Chart’ now illustrates the income these clients are expecting to generate prior to filing for social security in blue.
The Assets chart now represents the number of assets needed in today’s dollars, set at a growth rate that you determine, to achieve the level of income illustrated on the Income chart.
In this example, you will notice that this couple needs approximately $190,970 today, set at a 9% asset growth rate, in order to bridge the gap of income from the beginning of their retirement until filing for social security.
The green Benefit Replacement income layer works similarly but represents the gap in income that results after the first spouse in a couple passes away. In this example, this couple needs approximately $47,474 today, set at a more conservative 6% growth rate, to maintain the same level of income after the first spouse passes.

Perhaps solely relying on Social Security in retirement isn’t going to cut it for your clients and they are confident they will need more income in retirement, on top of what will be coming from Social Security. This is where the last two Income Layers come into play, Income Floor and Additional Income.
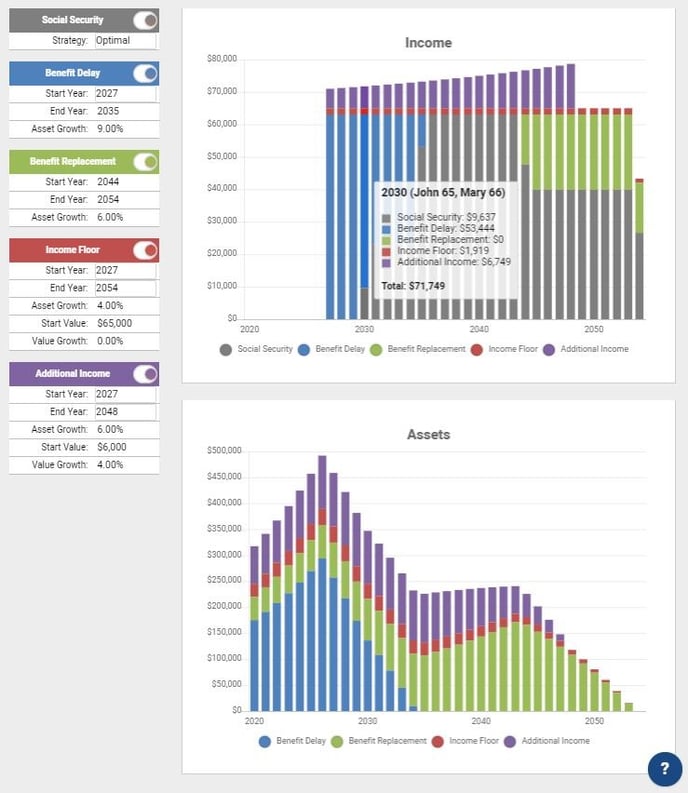
Let’s assume that the clients we have been working with throughout this article determined that the absolute minimum amount of income they need each year is $65,000 and they also want to set aside an additional $6,000 per year for traveling. Within the screenshot below, you will notice the red Income Floor and purple Additional Income toggles were turned on. Income Floor was set to $65,000 to satisfy this couple’s minimum income they hope to generate in retirement. Now, the Income chart illustrates all the various layers of income this couple is expecting to generate in retirement, and the Assets chart illustrates the number of assets needed today to get there.
